4.3 Datasets
4.3.1 Data model
City Digital Twin datasets are divided into 3 main interconnected domains:
- master data (the green blocks on the picture)
- fact-oriented datasets (divided by demographics, and economic and social facts)
- document-oriented datasets
Fact- and document-oriented datasets are based on dimensions placed in master datasets.

Data model of City Digital Twin database
4.3.2 Master data
Master data tables are stored in the relational database PostgreSQL DBMS. Access to master data tables is implemented through functions in the R package called DTwinDW.
Master data tables contain the attribute set of keys and include the following catalogs:
- Сatalog of Indicators (indicator)
- Сatalog of Territories (location)
- Сatalog of Industries (okved)
- Сatalog of Ages
- Сatalog of Genders (sex)
- Сatalog of Scenarios (scenario)
- Сatalog of Time Periods (time)
- Сatalog of Units of Measurement (unit)
The Catalog of Indicators contains information on basic, relative and generalized indicators of social and economic development and natural-anthropogenic development.
Quantitative metrics of master data:
## > *Master data currently available on the server. The database includes catalogs of Indicators, Territories, Industries, Ages, Genders, Scenarios, Time Periods, and Units of Measurement.*4.3.3 Basic SED indicators
4.3.3.1 Regional indicatore
Regional indicators of social, economic, and industrial development based on data from official bodies of statistics and publicly available regional data, including:
Actual values (74,000 macroeconomic values, 1.3 million industry values) for the following groups of indicators:
demographic indicators (8 items)
economic indicators (63 items)
social and other indicators (19 items)
| Region | Indicator | Year | Value | Region.code | Indicator.code |
|---|---|---|---|---|---|
| Father | Domestic product | 2000 | 16178.9 | 58000000 | C706 |
| Asmakhan | Population over working age | 2018 | 277117.96 | 69000000 | C042 |
| Trupits | Tax revenues of budgets of all levels | 2017 | 113369.62 | 47000000 | C708 |
| Opossit | Total area of residential premises | 2009 | 29892293.2 | 94000000 | C149 |
| Dassault | City budget expenditures, including: Road facilities (road funds) | 2020 | 10320 | 56000000 | C074 |
| Primavera | City budget expenditures, including: Housing and communal services | 2017 | 20529 | 04000000 | C075 |
| Stronger | City budget revenues, including: State duty | 2018 | 256 | 24000000 | C058 |
- Estimated indicators (21.4 million items) of social and economic development and strategic goals (143 groups of indicators)
| Indicator | Year | Value | Region.code | Indicator.code |
|---|---|---|---|---|
| Tax revenues of budgets of all levels | 2009 | 236.09 | 61000000 | C708 |
| Tax revenues of budgets of all levels | 2023 | 0.88 | 53000000 | C708 |
| Final consumption | 2001 | 631.32 | 98000000 | C952 |
| Gross value added | 2007 | 1440.71 | 17000000 | C784 |
| Р24103 Current income tax (For the reporting period) | 2029 | 0.62 | 18000000 | C499 |
- Analytics for the period 2000-2021 (actual data) and for 2020-2050 (inertial and investment forecasts)
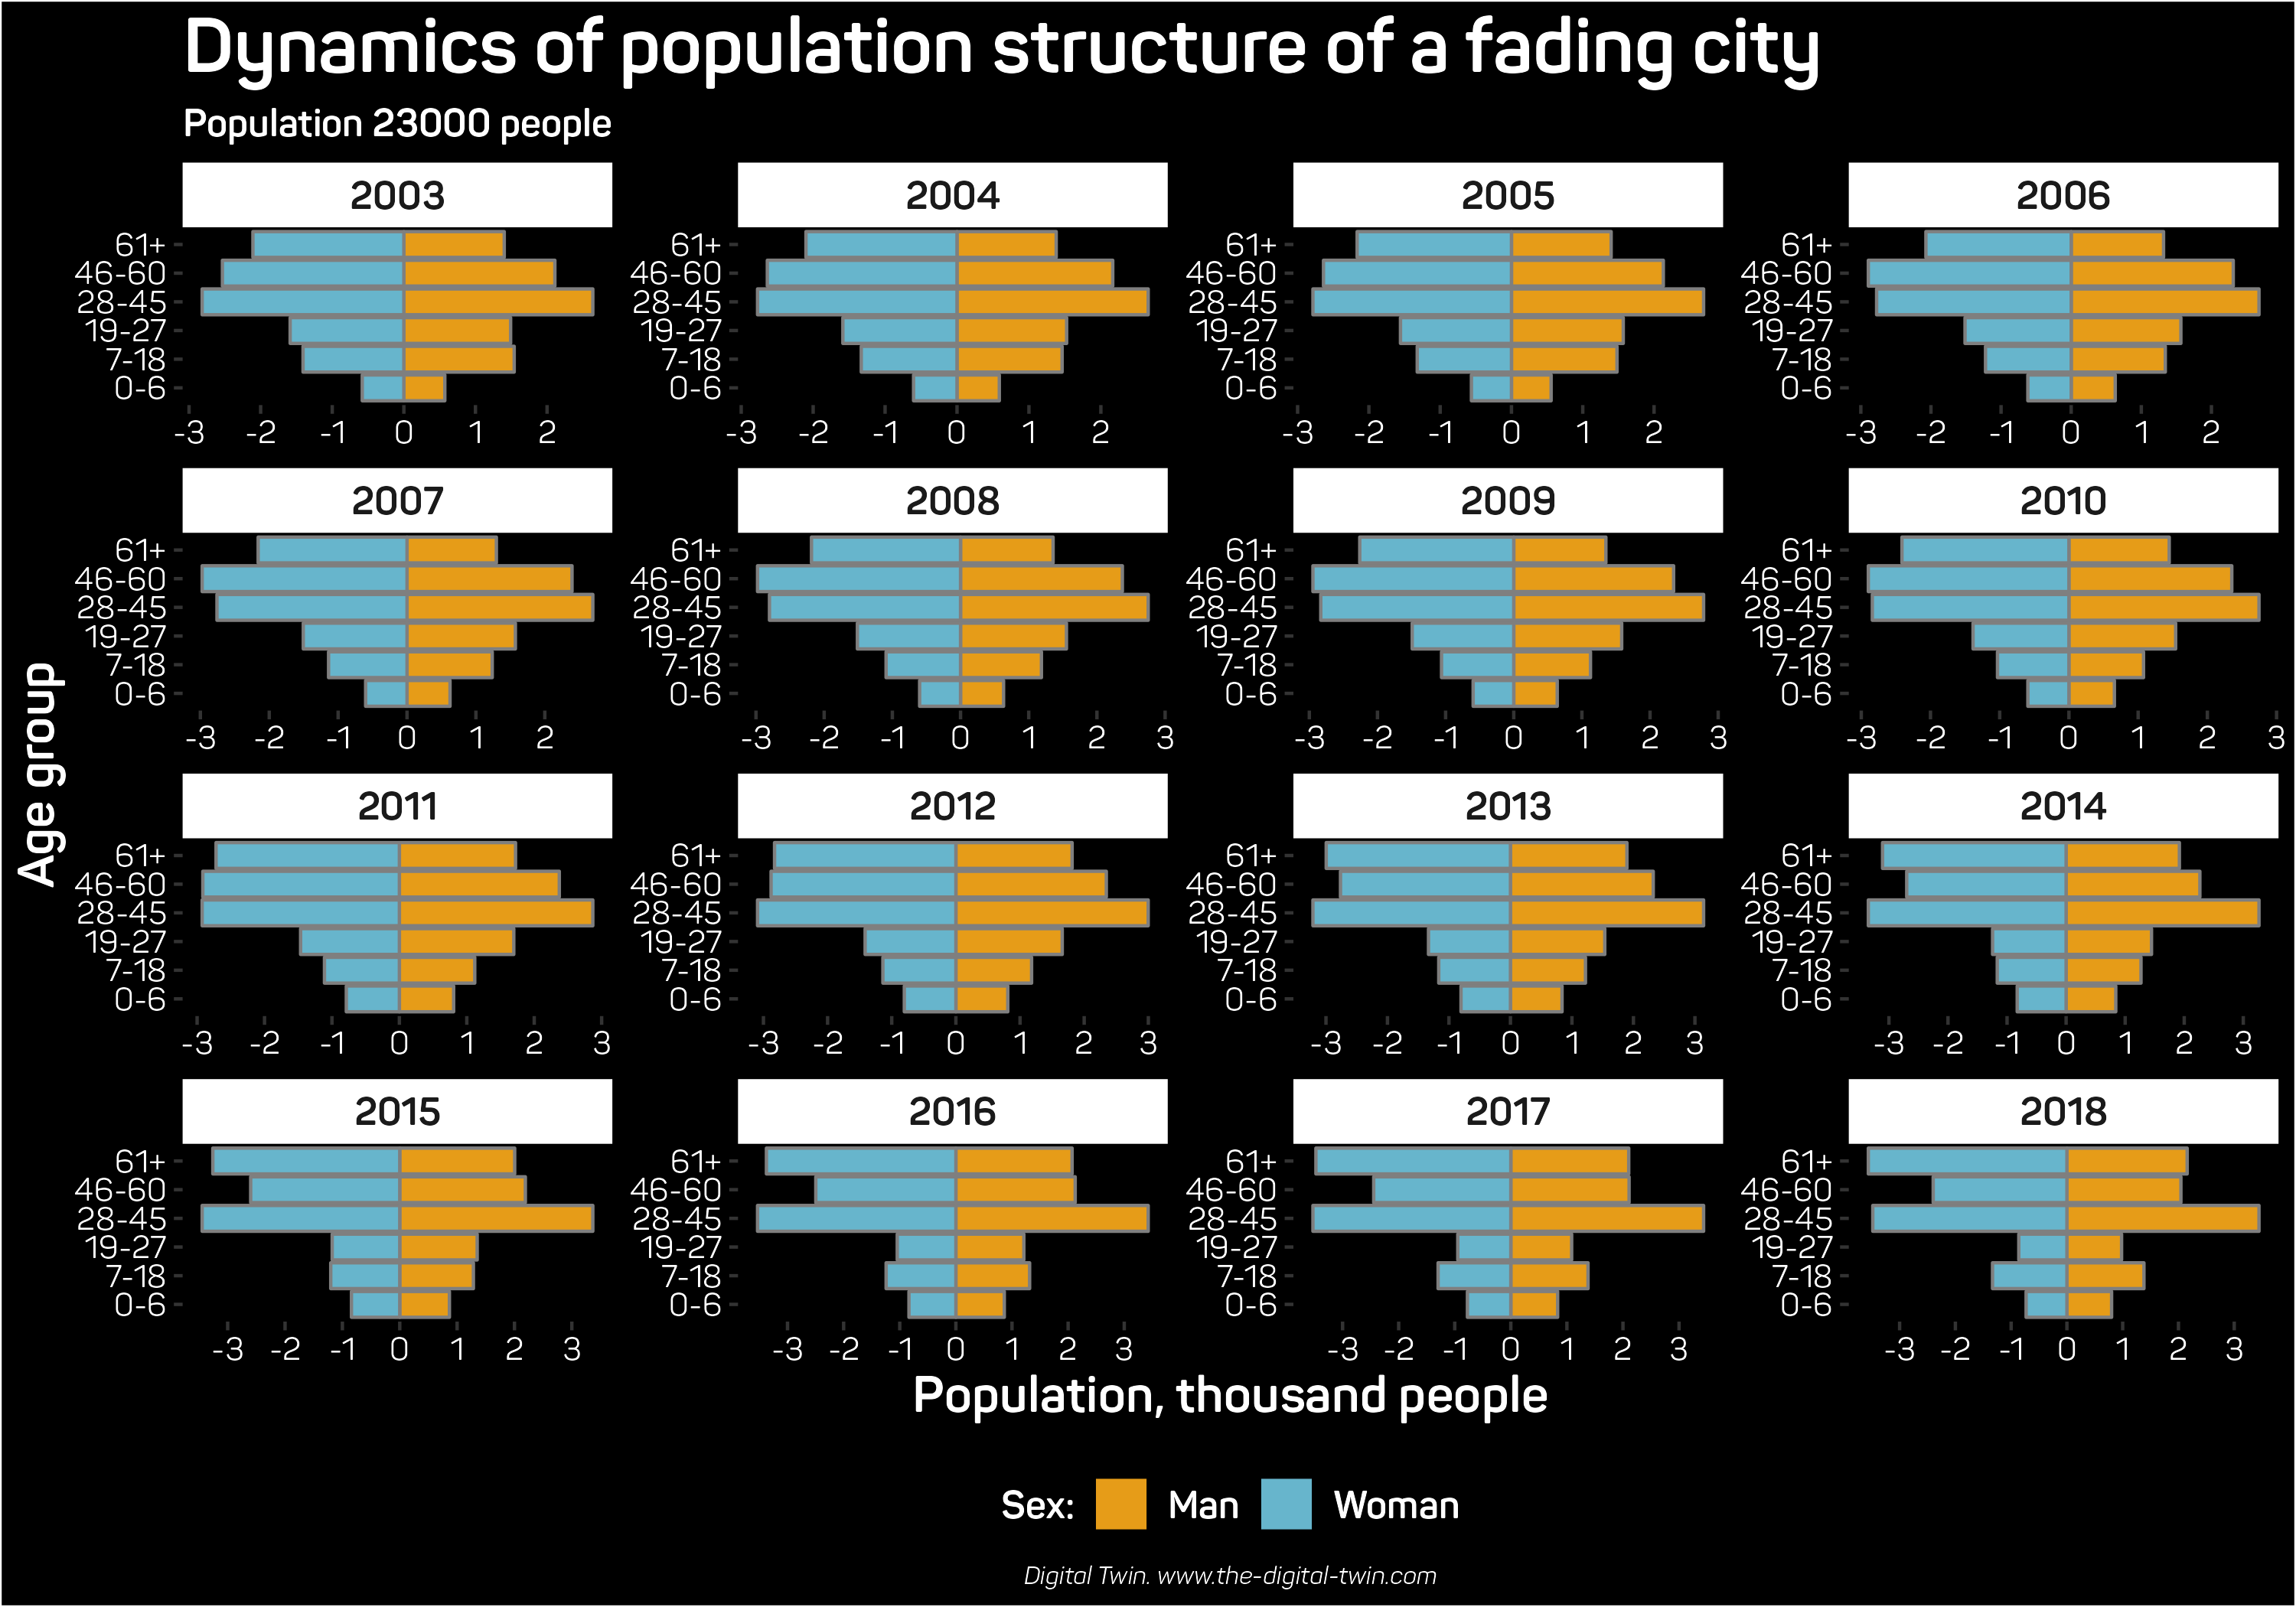
- Gender and age structure and migration flow estimations (including commuting) for demographic indicators
- Industry analytical data segments for 85 industries (of level 1) and 128 industries (of level 2)
| region | industry | indicator_name | year | value | location | industry.code | Indicator.code |
|---|---|---|---|---|---|---|---|
| Region 1 | Information technologies | Income | 2023 | 2760.29 | 46000000 | 63 | C493 |
| Region 2 | Air & space industry | All leve budget tax revenues | 2023 | 5268.75 | 65000000 | 51 | C708 |
| Region 3 | Machinery manufacturing | Gross profit (loss) | 2028 | 426.6 | 84000000 | 28 | C479 |
| Region 4 | Creative industries | CoGS | 2024 | 915.25 | 67000000 | 90 | C1048 |
| Region 5 | Delivery services | Cost of sales | 2027 | 9.19 | 81000000 | 53 | C477 |
| Region 6 | Paper manufacturing | Fixed capital | 2024 | 0.17 | 08000000 | 17.2 | C481 |
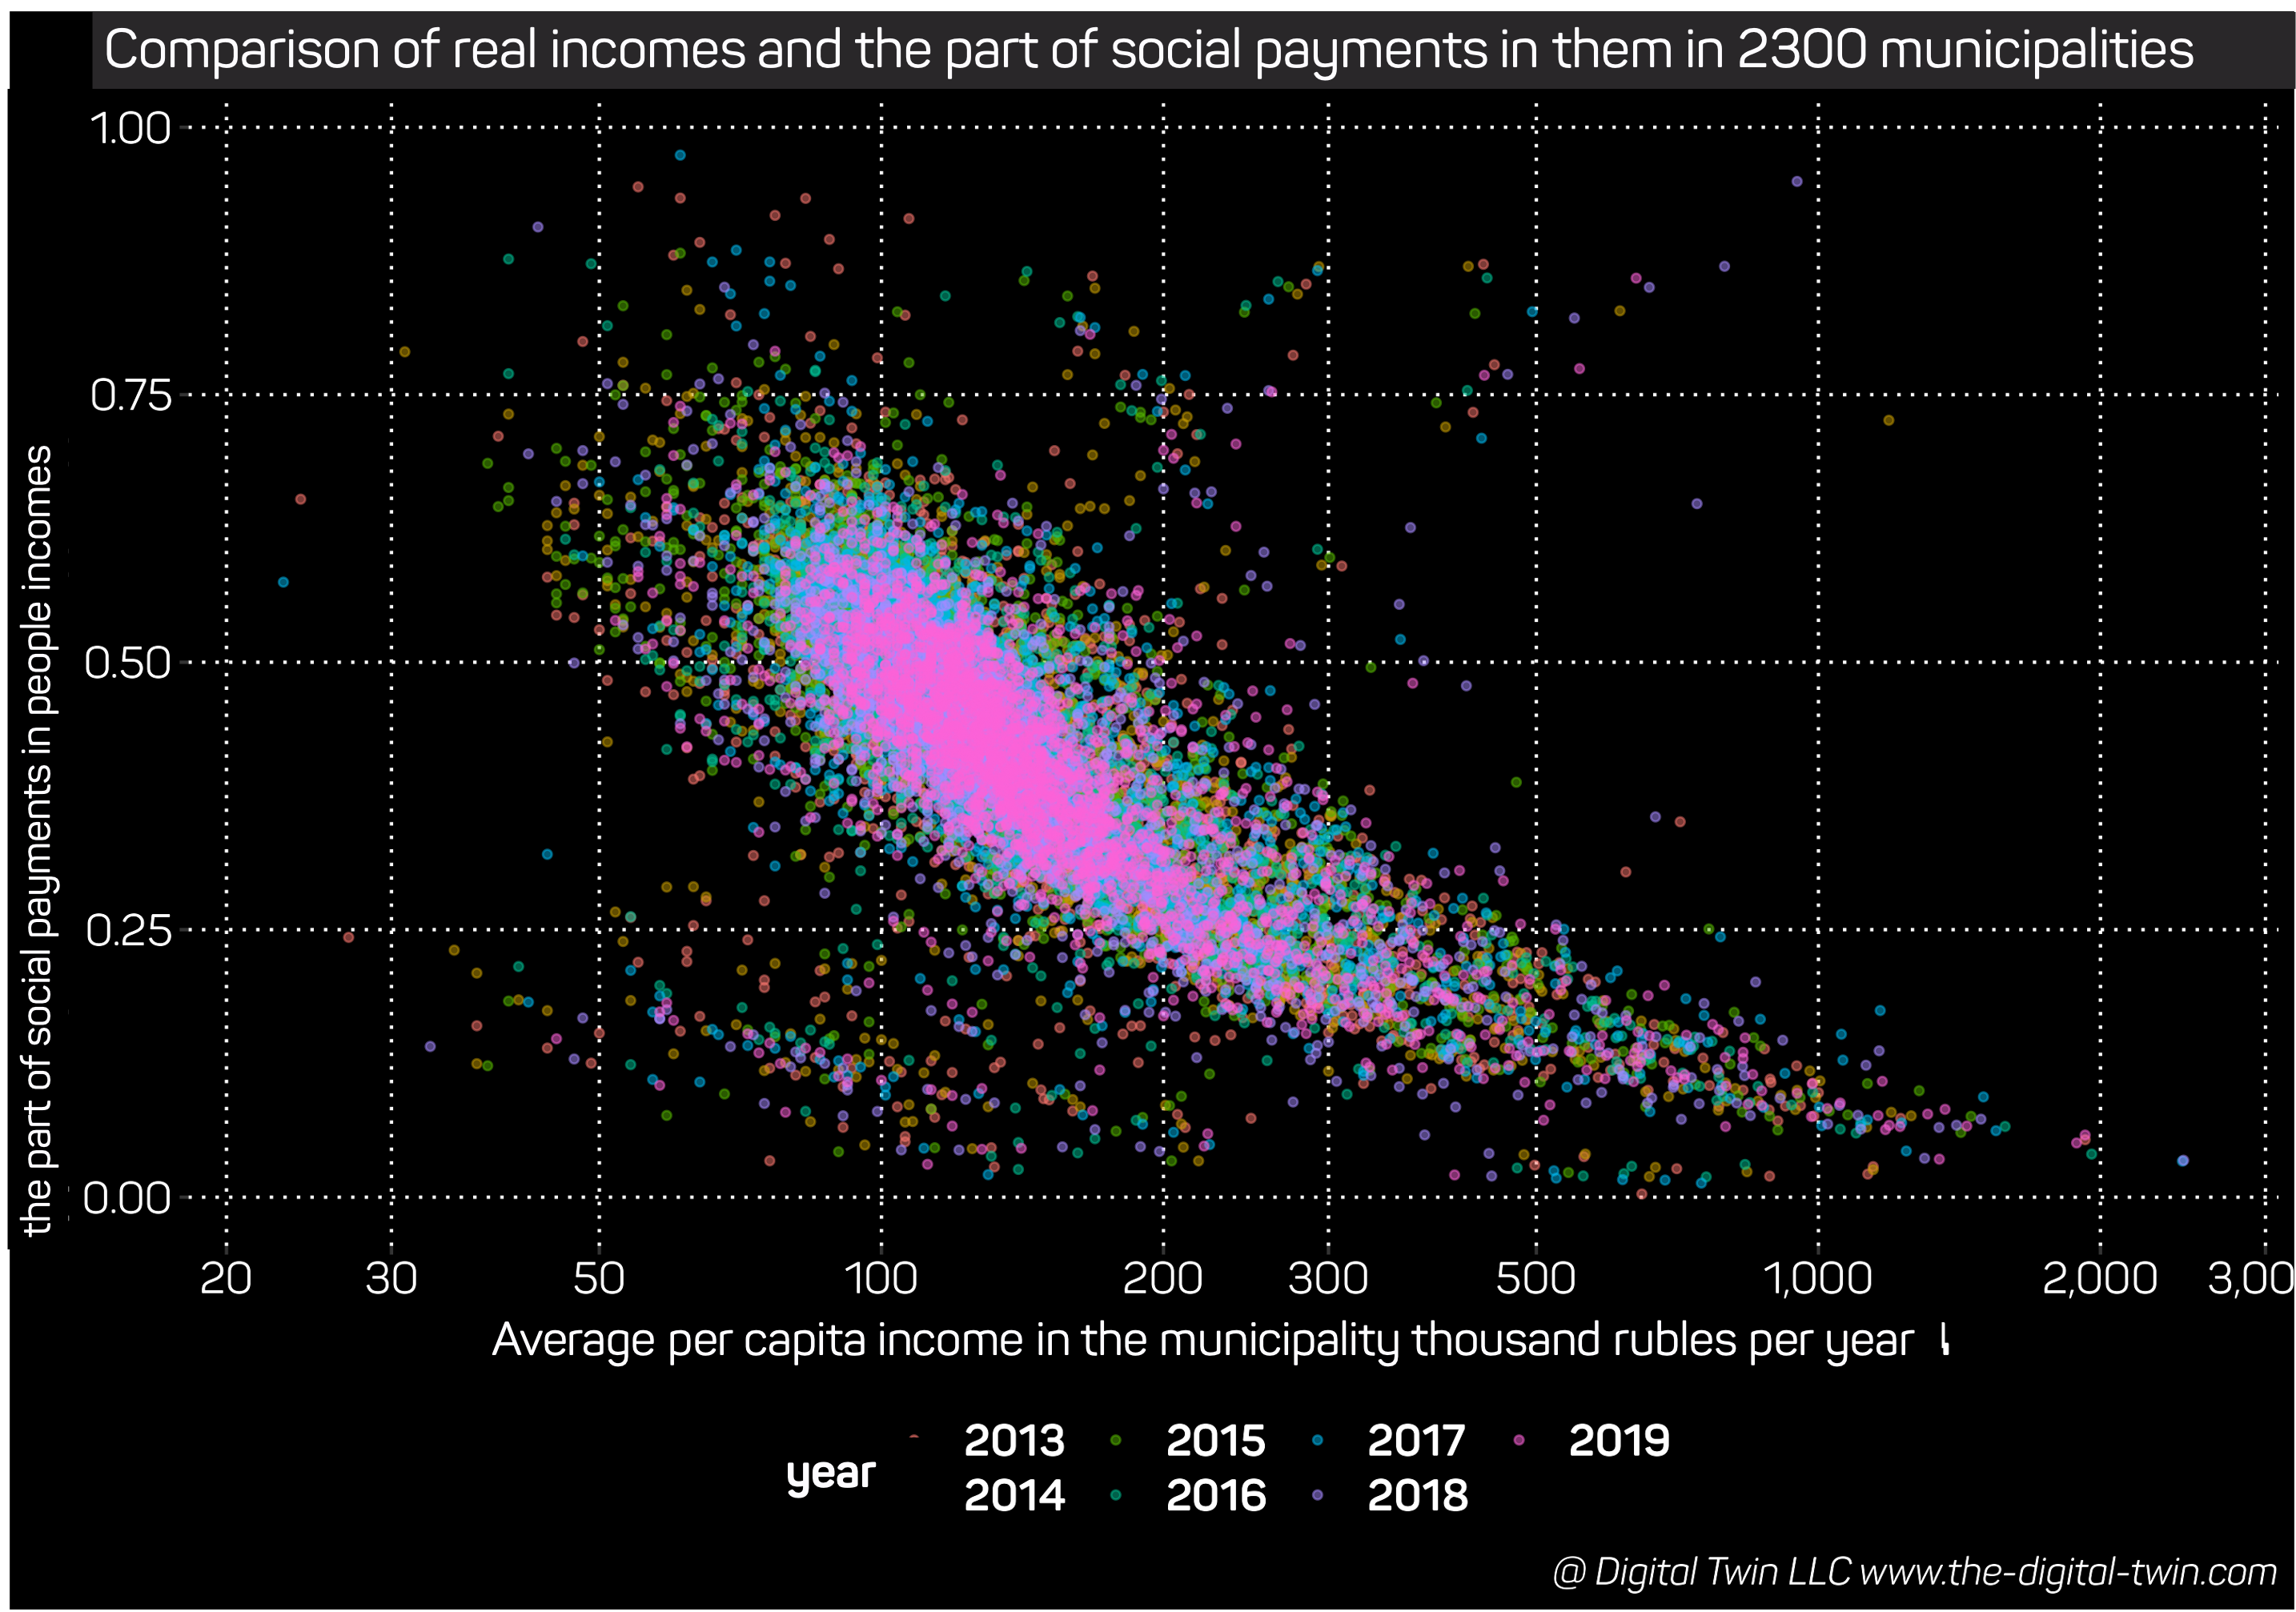
- Municipal analytical data segments of 2,300 municipalities
- Scenario analytical data segments - inertial scenario and investment scenarios (taking into account the impact of investment projects and programs available) of the social and economic development of territories
| scenario | indicator_name | region | year | value | location | indicator |
|---|---|---|---|---|---|---|
| invest | Growth of household earnings | Region 1 | 2023 | 0.04 | 77000000 | C003 |
4.3.3.2 Municipal indicators.
Municipal indicators (291 items) aggregated to the regional level from the municipal statistics database and the balance sheets of the Federal Tax Service, including:
- Actual values (16 million macroeconomic and 24.4 million sectoral indicators) for the following groups of indicators:
- demographic indicators (33 items)
- economic indicators (142 items)
- social and other indicators (69 items)
- demographic indicators (33 items)
 * Estimated indicators (21.4 million items) of social, economic development and strategic goals (143 items)
* Analytics for the period 2009-2021 (actual data) and for 2020-2050 (inertial and investment forecasts)
 * Gender and age structure and estimated migration flows (including commuting) for demographic indicators.
 * Industry analytical data segments of 85 industries (of level 1) and 128 industries (of level 2)
* Municipal analytical data segments - 24,221 settlements
* Scenario analytical data segments - inertial scenario and investment scenario (taking into account the impact of investment projects and programs available)
4.3.4 Matrices of socio-economic ties
Matrices of socio-economic ties are intended for the formation of analysis and estimates, forecasts, and scenario-based planning.
Matrices allow you to quickly estimate a variety of scenarios and evaluate the intersectoral and interterritorial impact of management decisions (investment projects and regulatory decisions) on socio-economic development.
Regional and municipal intersectoral balance matrices based on 128 industries of the 2nd level for the actual data for 2016-2021 and for the forecast period of 2022-2040 for calculating intersectoral and interterritorial effects, including tables:
- Resources in terms of goods and services
- Use of goods and services at buyers’ prices
- Use of goods and services at basic prices
- Use of domestic products at basic prices
- Use of imported products
- Trade and transport margins
- Taxes (net of subsidies) on products
- Matrix of multipliers (production and technological coefficients)
- Resources in terms of goods and services
Interterritorial balances, including estimates of the directions of passenger traffic, cargo traffic, exports, and imports.
Correlation matrices (sensitivity matrices) for scenario calculations for the impact of management decisions on the dynamics of socio-economic development indicators. These include an assessment of the impact of basic indicators (30 indicators on 30 indicators) characterizing socio-economic development for 2020-2050.
Influence matrices (mutual influence through principal components and/or eigenvectors) of indicators (291 indicators x 7 indicators x 291 indicators), allowing observers to evaluate the impact of a scenario change in any indicator (taking into account the analytical data segment) from the database on the change of all indicators in the medium term (3-5 years) and long term (5-30 years).
4.3.5 Management Decisions
With the help of Digital Twin, it is possible to assess the impact of the inertial development of territories based on the following management decisions:
- changes in monetary policy parameters, including (consumer price index, refinancing rate, and the tax burden)
- parameters of strategies and forecasts for socio-economic and sectoral development
- plans and programs for the development of territories and industries
- industry schemes
- investment projects, portfolios, and programs
To date, a portfolio of investment projects has been collected and evaluated. It includes data on investment projects (46 thousand projects) carried out from 2002 to 2025, mainly using federal budget funds.
Data sources are:
- the federal investment program
- electronic budgets
- investment decisions
- investment projects of financial institutions
The initial data on the impact of investment decisions on a project may contain the following characteristics:
- volumes and sources of financing
- location of financing objects
- the type of capital construction object
- its address
- the start and completion dates of the project
Estimated indicators (146 items) of investment projects include an assessment of the indicators of the financial flow of the project (based on the median values of the target region) and an assessment of their impact on the dynamics of socio-economic development indicators.