7.7 Model for assessing the impact of city parks on socio-economic development and ESG (Ecology, Social, Governance) indicators
7.7.1 Purpose of the model
The model for assessing the impact of city parks on indicators of socio-economic development of the city and on ESG (Ecological, Social, Governance) has several key tasks:
Determination of environmental impact - Assessment of the ability of parks to reduce air and environmental pollution, improve water balance and urban biodiversity. Assessment of social impact - Measuring the degree of influence of parks on the health and well-being of citizens, improving the quality of life, providing access to green spaces for recreation and sports, creating conditions for communication and socialization of people. Management efficiency analysis - How effectively park management is carried out, whether there are clear rules and norms, how much funds are invested in the maintenance and improvement of parks. Assess the impact on the socio-economic development of the city - Does the presence of parks contribute to attracting tourists and creating new jobs, does it increase the quality of life and real estate value near parks, does it increase the city’s attractiveness for investment.
Such a model allows city leaders to make informed decisions about investments in parks and balance the interests of social, environmental, and economic goals.
7.7.2 Basic view of the model
The basic view of the Model for assessing the influence of city parks on indicators of socio-economic development of the city and on ESG (Ecological, Social, Governance):
\[ \frac{d Q_{i}}{d t}=k_{t} F_{i S}\left(\frac{d S}{d t}\right)+k_{t} F_{i V}\left(\frac{d V}{d t}\right)+k_{t} F_{i C_{k}}\left(\frac{d C_{k}}{d t}\right)+k_{t} F_{i C_{k}}\left(\frac{d C_{k}}{d t}\right) \ldots \ \ (1) \]
where \(\frac{d Q_{i}}{d t}\) - increment of the output indicator, \(F_{a b}\) - transfer function as increment b passes into increment a, \(k_{t}\) - normalization correction coefficient, \(\frac{d S}{d t}\) - change in the area of parks in the city created by the project, \(\frac{d V}{d t}\) - change in the volume of funds for greening in the city created by the project, \(\frac{d C_{k}}{d t}\) - inertial predicted changes in other indicators on which the desired indicator depends.
The main task of the Model is to find the transfer functions \(F_{a b}\).
7.7.2.1 Procedure for forming transfer functions
- General view of the transfer function.
\[ \begin{gathered} F_{\frac{d S}{d t}}=k_{1}\frac{1}{1+\frac{d S}{d t}}+k_{2} \frac{d S}{d t}+k_{3}\left(\frac{d S}{d t}\right)^{2}+k_{4} \frac{1}{1+\left(\frac{d S}{d t}\right)^{2}}+k_{5}\left(\frac{d S}{d t}\right)^{3}+k_{6} \frac{1}{1+\left(\frac{d S}{d t}\right)^{3}} \\ +k_{7} \frac{1}{1+\sin \left(\frac{d S}{d t}\right)} \\ +k_{8} \sin \left(\frac{d S}{d t}\right)+k_{9} \frac{1}{1+\sin \left(\frac{d S}{d t}\right)^{2}}+k_{10} \sin \left(\frac{d S}{d t}\right)^{2}+k_{11} \frac{1}{1+\cos \left(\frac{d S}{d t}\right)} \\ +k_{12} \cos \left(\frac{d S}{d t}\right)+k_{13} \frac{1}{1+\cos \left(\frac{d S}{d t}\right)^{2}}+k_{14} \cos \left(\frac{d S}{d t}\right)^{2} \end{gathered} \ \ (2) \]
We do not know what the character of the transfer function is, so we use an exhaustive list of functions and, with the help of training on a large sample, adjust the coefficients. Thereby we find the actual character of the function’s behavior.
- Formation of the training sample
The model uses several sets of data from various sources (full list of indicators Appendix 1 to this section):
- 2GIS - area characteristics of SEO (Socio-Economic Objects),
- municipal statistics of Rosstat,
- approved urban planning standards (MNGP/RNGP)
To obtain a sufficient amount of data for training, we group cities by the principle of similarity; we called them “sister cities”. The principle of similarity in this context means the proximity of cities in a 400-dimensional (by the number of indicators available for each city) space. From this, a hierarchical classification is formed:
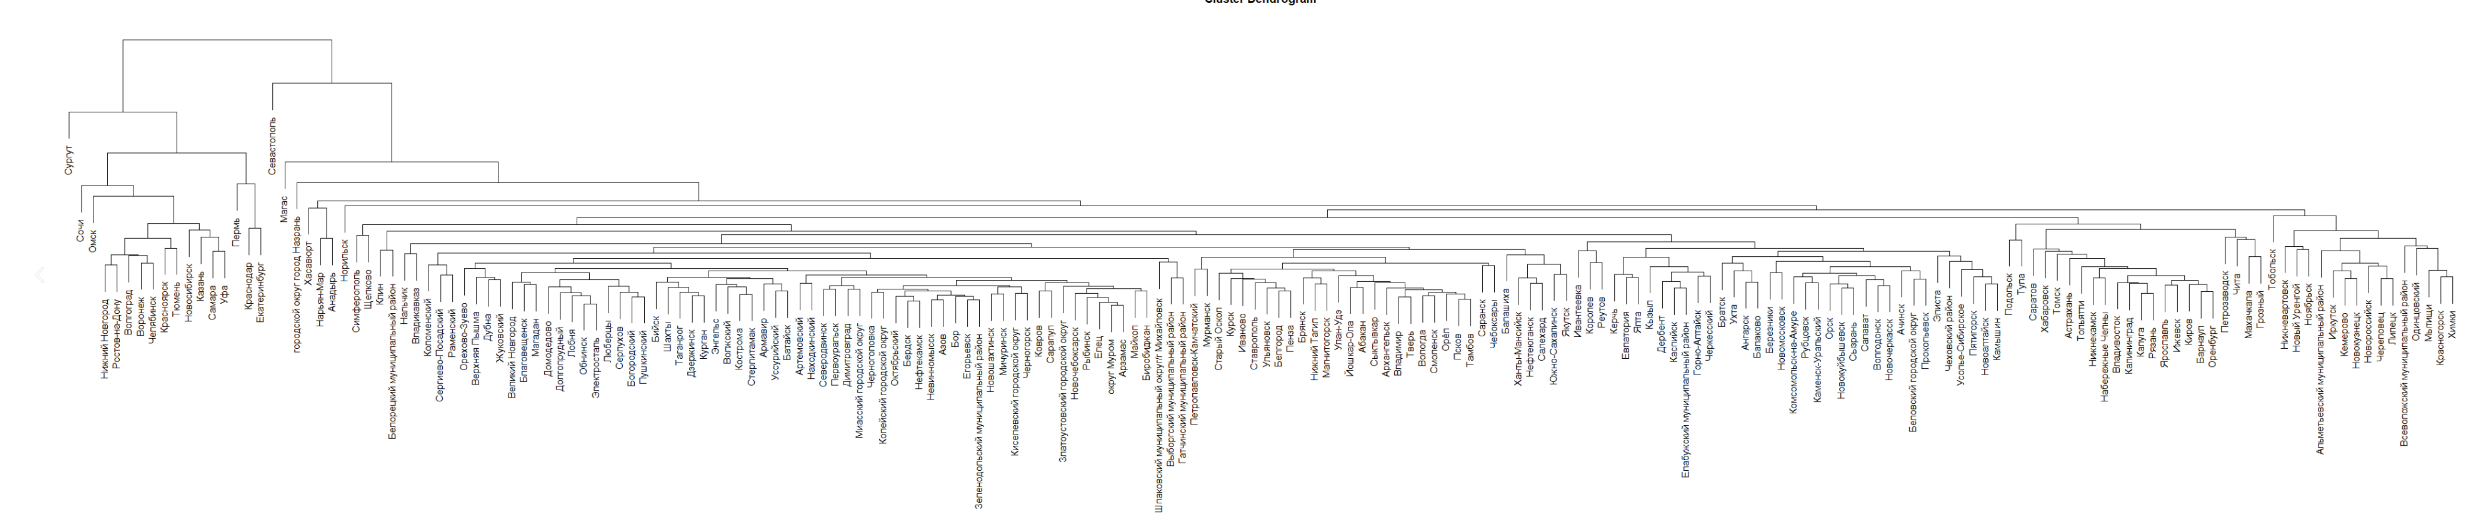
Example of city classification
We proceed from the assumption that the dynamics and effects are similar within the group. Thus, the training sample increases by 4-5 times.
- Data preparation
Since we are considering increments, it is necessary to subtract the trend from the original series so that the model takes into account only medium-term and short-term changes. We define the trend as the lowest frequency harmonic in the Hilbert transform. After which we get a series that is normalized. Thus we get a training sample.
- Compilation of a sample of dependent and influencing indicators
For each output indicator, indicators are determined that mainly influence the output indicator. To correct this sample, the completeness of the fraction of the variance of the original indicator is used, which is described by a set of \(n\) influencing indicators.
This happens based on the multiplication of PCA (Principal Component Analysis) matrices (synthetic variables are taken that together give 95% completeness) by its inverse, and the mutual influence of each indicator on each indicator is obtained.
For example, for the “Housing provision” indicator, this list includes:
- Average monthly nominal wages of employees of organizations, total
- Presence in the urban district (municipal district) of an approved master plan of the urban district (territorial planning scheme of the municipal district)
- Budget expenditures for the maintenance and development of green spaces
- Population as of January 1 of the current year
- Average headcount of employees of organizations, total
- Population younger than working age
- Population arrivals (migration)
- Population departures (migration)
- Commissioning of individual residential buildings
- Commissioning of residential buildings (apartment buildings and individual housing)
- Number of births
- Provision with sports facilities
- Population of working age
- Area of parks, sq. m.
- After obtaining the training sample, the model is calibrated by the mean absolute error for all coefficients. After the convergence of the model (error less than 10%), the model is considered trained and ready for use.
7.7.3 Input data
To assess the impact of investments in city parks, input parameters are used, the values of which are set by the user:
| № | Name | Unit of measurement | Indicator code or variable name | Data type | Note |
|---|---|---|---|---|---|
| 1 | City | location | string | The user selects one city from the list, the calculation module receives the 8-digit OKTMO code of the city | |
| 2 | Project type | type | string | The user selects one of two values: 1. Creation of a new object = “new” 2. Reconstruction of an existing object = “req” | |
| 3 | Object area | hectare | C1188 | floating point number | A positive number from 0.1 to 1,000,000 is indicated |
| 4 | Investment volume | million rubles | C1115 | floating point number | A positive number from 0.1 to 1,000,000 is indicated |
| 5 | Project start year | year | start_year | number | An integer in the range from 2020 to 2040 is indicated |
| 6 | Year of completion of the investment stage of the project (transition to the operational stage) | year | invest_end_year | number | An integer in the range from the next after the start year of the project to the end year of the project evaluation period is indicated |
| 7 | Year of completion of the project evaluation period | year | end_year | number | An integer in the range from 2020 to 2040 is indicated. The year of completion of the project evaluation period must be equal to or greater than the year of completion of the investment stage of the project |
Restrictions on input parameters applied in the Module for the influence of investments in city parks: - Minimum project start year - 2020 - Maximum year of completion of the project evaluation period - 2040 - Minimum project duration - 1 year - Maximum project duration - 20 years
7.7.4 Output data
As output parameters, the Module for the influence of investments in city parks forms the following set of indicators:
| № | Group | Name | Unit of measure | Indicator code |
|---|---|---|---|---|
| 1 | E (environmental) | Total amount of pollutants | tons | C108 |
| 2 | S (social) | Captured and neutralized air pollutants | tons | C109 |
| 3 | Average monthly nominal wages of employees of organizations | rubles/month | C261 | |
| 4 | Housing provision | sq.m/person | C804 | |
| 5 | G (governance) | Number of small and medium-sized businesses per 10 thousand people | units | C1173 |
| 6 | Migration growth of the population | people | С037 |
Properties of output indicators 1. Indicators are provided as a data series from the project start year to the project evaluation period end year. 2. The data series is an instantaneous effect for each year. 3. Effects from the object area (C1188) occur after the completion of the investment phase of the project, i.e., after the opening of the city park. 4. Effects from the volume of investments (C1115) occur immediately after the start of work.
7.7.5 Result of model application
The model is implemented in two versions:
as a separate calculation module
integrated into a single calculation module, including:
- Model for assessing the impact of an investment project on socio-economic indicators
- Model for assessing the impact of a portfolio of investment projects on socio-economic indicators
- Model for assessing the impact of city parks on indicators of socio-economic development of the city and ESG (Ecology, Social, Governance)
- Scenario calculation module for the socio-economic performance of transport projects using the GIH methodology
During trial operation, the model confirmed its efficiency in target cities entered into the unified calculation Module for assessing the impact of investment projects on various socio-economic indicators of the city.
7.7.6 Requirements for model support and regularity of recalibration
It is advisable to carry out model calibration once a year after the publication of new statistical data used by the model. Increasing the amount of statistical data can improve the accuracy of the effects provided.
7.7.7 Assumptions necessary for carrying out calculations
Restoring missing data using “sister cities” leads to similar effects in the model output.
7.7.8 Scope (boundaries) of permissible application of the mathematical model
Since the Model is calculated on data of short-medium term increments and the influence of the trend is excluded. Investment projects with a park area of more than 30% of the total area of parks in the city and/or an investment volume of more than 50% of the total costs for improvement and greening of territories may lead to non-interpretable results. This situation is partially regulated by taking into account the investment potentials of the city. If the volume of investments exceeds the investment potential, then they are limited by its size.
7.7.9 Appendix 1
| Code | Name |
|---|---|
| C707 | Gross value added of small and medium-sized businesses (SME) |
| C241 | Payroll of all employees of organizations, total |
| C475 | Revenue (For the reporting period) |
| C698 | Taxable money income of individuals and individual entrepreneurs |
| C708 | Tax revenues of budgets of all levels |
| C709 | Local budget revenues (tax and non-tax) |
| C035 | Number of deaths |
| C477 | Cost of sales (For the reporting period) |
| C421 | Inventories (At the reporting date of the reporting period) |
| C908 | Emitted air pollutants |
| C261 | Average monthly nominal wages of employees of organizations, total |
| C479 | Gross profit (loss) (For the reporting period) |
| C640 | Payments by organizations, including those related to employee compensation (For the reporting year) |
| C149 | Total floor area of residential premises |
| C081 | City budget expenditures, including: Social policy |
| C077 | City budget expenditures, including: Education |
| C1173 | Number of small and medium-sized businesses per 10 thousand people |
| C1156 | Share of the length of public roads of local importance that do not meet regulatory requirements in the total length of public roads of local importance |
| C1163 | Share of children aged 1–6 years registered for placement in municipal preschool educational institutions in the total number of children aged 1–6 years |
| C433 | Current assets of organizations under Section II of the balance sheet (At the reporting date of the reporting period) |
| C1165 | Specific value of thermal energy consumption by municipal budget institutions per 1 sq. m of total area |
| C1171 | Presence in the urban district (municipal district) of an approved master plan of the urban district (territorial planning scheme of the municipal district) |
| C1174 | Expenditures of the municipal budget for the maintenance of local government employees per resident of the municipality (2008, thousand rubles) |
| C050 | City budget revenues, including: Personal income tax |
| C013 | Population as of January 1 of the current year |
| C221 | Average headcount of employees of organizations, total |
| C804 | Housing provision (sq.m./person) |
| C1188 | Area of parks, sq. m. |
| C040 | Population younger than working age |
| C042 | Population older than working age |
| C037 | Population arrivals (migration) |
| C038 | Population departures (migration) |
| C818 | Number of employees in small and medium-sized businesses |
| C181 | Number of public (general access) libraries |
| C757 | Integral provision of SEO (Socio-Economic Objects) |
| C711 | Full cost |
| C097 | Commissioning of individual residential buildings |
| C697 | Money income of the population |
| C096 | Commissioning of residential buildings (apartment buildings and individual housing) |
| C815 | Population employment |
| C002 | Life expectancy at birth |
| C034 | Number of births |
| C207 | Number of shops |
| C516 | Total financial result of the period (For the same period of the previous year) |
| C510 | Net profit (loss) (For the same period of the previous year) |
| C1029 | Retail trade turnover per capita |
| C1034 | Number of small and micro enterprises per capita |
| C108 | Total amount of pollutants |
| C753 | Provision with sports facilities |
| C041 | Population of working age |
| C109 | Captured and neutralized air pollutants |
| C165 | Number of hospital beds (round-the-clock hospitals) |
| C1115 | Budget expenditures for the maintenance and development of green spaces |
| C699 | Population income: social and other payments |