7.10 Model for assessing commuting migration
7.10.1 Purpose of the model
In the description of the model, we will consider commuting migration using the example of agglomerations. However, the algorithms and methods embedded in the model are easily scalable to cities, regions, and the country as a whole.
By agglomeration, we will mean a region that includes a number of cities and municipalities that, due to population growth and physical expansion, have merged into one industrialized area.
The model is designed for:
- assessment and analysis of labor resource imbalances (population - places of employment) in municipalities (districts), which are the source of commuting migration between the settlements of the agglomeration (transport correspondences),
- determination of transport correspondences most loaded by commuting migration - “bottlenecks”,
- assessment of the need for capital investments required for the balanced development of the road network, reduction (including equalization) of the congestion of transport correspondences
The model allows for the assessment of basic indicators for individual municipalities, transport correspondences between them, and the formation of integral indicators for the agglomeration as a whole.
Calculations of basic indicators using the model are performed for a retrospective and forecast period up to 2032.
7.10.2 Terms and definitions
Area (district) - a settlement, municipality, or municipal district, which within this calculation is a single whole. Trips of people inside settlements are not taken into account. Transport correspondence - a group of routes passing between two areas for which an aggregated throughput and effective length are calculated. Effective length of transport correspondence - the calculated distance connecting municipalities within the agglomeration. It is calculated by constructing for each pair of municipalities the shortest routes between the settlements included in them on an “each to each” principle and determining the arithmetic mean length. Measured in kilometers. Throughput of transport correspondence - a coefficient characterizing the capacity of the road network by road categories, taking into account the number of lanes and the quality of the road surface, allowing to provide a given intensity of vehicle traffic. Measured in conventional throughput units. Commuting migration - the process of moving people from their place of residence to their place of work in another area and back. Congestion of transport correspondence - the ratio of the flow of people passing through transport correspondence to its throughput. Average headcount - average headcount of employees of enterprises (within this model, it coincides with the number of jobs, which is within the overall error of the model). Unaccounted employment - employment of people not reflected in the average headcount. Permanent migration without registration - the process when a person moves to a place of work and rents a room, apartment, or other place of residence, but does not register and is not displayed in the official data on the working-age population. Migration outside the agglomeration - migration to settlements that are not part of the agglomeration. It can be both commuting and permanent, with registration at the new place of residence, or without registration. OKTMO - all-Russian classifier of territories of municipalities, as well as the code of the municipality according to this classifier.
The model uses the following types of roads according to the OpenStreetMap classification:
Tertiary - local roads connecting district centers with villages, as well as several villages between themselves, mainly single-lane (without explicit lane separation) and two-lane, with a surface quality not designed for high loads. Secondary - regional roads connecting regional centers with large settlements (district centers), as well as large settlements between themselves, mainly two-lane. Primary - regional roads connecting large cities and/or regional centers, interregional roads, mainly four-lane, or two-lane with good surface quality and significant lane width.
7.10.3 Basic view of the model
A thermal model is used as a base for calculating labor balances. The model is based on a number of assumptions:
- people of working age, with high competition for jobs in one area, make trips to neighboring areas, equalizing the ratio of the number of people of working age to the number of jobs in the area. The model proceeds from the assumption that this process is completed completely and as a result, the specified ratio becomes the same for all areas of the agglomeration (the system reaches equilibrium). People flows depend on the conditions established at the transport correspondence: the more difficult it is for the population to get from one area to another (either because of the significant length of the road, or because of its low throughput), the less people strive to go in this direction.
- comparison of the average headcount and the number of people of working age indicates a high sum of three components: unemployment, unaccounted employment, and labor migration outside the agglomeration. Within the framework of calculations, unemployment and labor migration outside the agglomeration are not considered.
- unaccounted employment is proportional to the average headcount of workers in the agglomeration with a constant coefficient.
- migration of the population can be either permanent (with registration at a new place of residence, or without registration), or commuting (within one day). Permanent migration with registration at a new place of residence has already been taken into account in the Rosstat population data. Within the framework of this model, only commuting migration is studied.
- the period of time required by the population to equalize the load of jobs due to changes in the average headcount and the size of the working-age population (bringing the system into equilibrium) is less than the time between data measurements for average headcount and the size of the working-age population (1 year).
- throughput of transport correspondence between two areas is an aggregated value, equal to the sum of the throughputs of all roads leading directly from one area to another.
- length of transport correspondence between areas is calculated as the average value of the lengths of routes between all pairs of settlements from the two areas under consideration.
In all formulas below, unless otherwise specified, the summation indices run from 1 to N, where N is the number of areas.
The throughput between two areas \(\beta_{i, j}\) is determined using a physical model of thermal conductivity, which is a phenomenon similar to the process of commuting migration under study:
\[ \beta_{i, j}=\frac{c_{i j}}{\sqrt{L_{i j}^{2}+L_{0}^{2}}} \cdot \varphi \ \ (1) \]
where
\(L_{i j}\) - length of transport correspondence between areas \(i\) and \(j\), km. \(c_{i j}\) - throughput of transport correspondence between areas \(i\) and \(j\), conventional unit. \(L_{0}\) - equivalent of additional distance not covered, characterizing the time for preparation for movement (entering the main route), equal to 1 km by default. \(\varphi\) - “thermal conductivity” coefficient, measured in (km * people / time / throughput unit). \(\varphi\) determines the equalization rate of p/w, i.e., sets conventional time, and therefore, without loss of generality, the coefficient is set to 1.
The ratio of the number of people of working age to the number of jobs (average headcount). A dimensionless value, which is an analogue of “temperature” in the thermal conductivity equation:
\[ T_{i}=\frac{p_{i}}{w_{i}} \ \ (2) \]
where \(p_{i}\) - number of able-bodied residents in the area, people \(w_{i}\) - average headcount of the area, people
As an analogue of the “heat capacity” indicator of the area is average headcount = \(w_{i}\).
A flow of commuting migration (analogue of “heat”) is formed between the two areas, moving from areas with a lack of jobs (“more heated”) to areas with a higher level of provision of jobs (“less heated”):
\[ \frac{d T_{i}}{d t}=\frac{1}{w_{i}} \sum_{j} \beta_{i j}\left(T_{j}-T_{i}\right) \ \ (3) \]
where \(t\) - conventional time (proportional but not equal to real time), time units
Substituting “temperature”, we get:
\[ \frac{d p_{i}}{d t}=\sum_{j} \beta_{i j}\left(\frac{p_{j}}{w_{j}}-\frac{p_{i}}{w_{i}}\right) \ \ (4) \]
The problem is solved by the matrix exponent method:
\[ \hat{p}=\lim _{t \rightarrow \infty} p_{i}=w_{i} \cdot \frac{\sum p}{\sum w} \ \ (5) \]
This means that the population is distributed among jobs in equal proportion.
The total flows that passed through the transport correspondences are calculated by the following formula:
\[ f_{i j}=\int_{0}^{+\infty} \beta_{i j}\left(\frac{p_{j}(t)}{w_{j}}-\frac{p_{i}(t)}{w_{i}}\right) d t \ \ (6) \]
Additional variables are derived to ensure the calculations:
\[ \begin{gathered} \xi_{i j k}=\beta_{i j} \sum_{k}\left(\frac{\delta_{k j}}{w_{j}}-\frac{\delta_{k i}}{w_{i}}\right) \ \ (7) \\ M_{i j}=\frac{\beta_{i j}}{w_{j}}-\delta_{i j} \sum_{k}\left(\frac{\beta_{k i}}{w_{i}}\right) \ \ (8) \end{gathered} \]
Where the matrix \(M\) has \(N\) eigenvalues \(\lambda_{1} ... \lambda_{N}\). One of them is zero. And \(N\) corresponding eigenvectors. Let’s denote the transition matrix to the eigenbasis of matrix \(M\) as \(S\).
In this basis, the matrix \(M\) acquires a diagonal form \(\widetilde{M}\) (in general, the form can be in the Jordan form of the matrix, but within this task it is diagonal), and the integral \(\int_{0}^{t} \exp (\widetilde{M} \cdot \tau) d \tau\) has the form of a diagonal matrix
\[ \begin{gathered} \begin{cases} D_{i i}(t)=t, &\lambda_{i}=0 \\ D_{i i}(t)=\frac{\exp \left(\lambda_{i} \cdot t\right)-1}{\lambda_{i}}, &\lambda_{i} \neq 0 \\ \end{cases} \ \ (9) \\ \bar{p}=p-\hat{p} \ \ (10) \end{gathered} \]
The size of the commuting migration flow \(f_{i j}\) via transport correspondence is calculated as follows:
\[ f_{i j}=\lim _{t \rightarrow+\infty} \sum_{k l m n} \xi_{i j k} S_{k l} \cdot D_{l m}(t) \cdot S_{m n}^{-1} \cdot \bar{p}_{n} \ \ (11) \]
The time parameter \(t\) used in the calculation parameterizes the process of disseminating information between residents about the availability of vacancies in a neighboring area and cannot be interpreted as physical time during which residents migrate.
As a result of this calculation, \(f_{i j}\) is obtained - the number of people who need to migrate to other areas daily to equalize the imbalance parameter \(p/w\).
The commuting migration indicator creates a load on the transport correspondence \(U_{i j}\), which can be calculated by the formula:
\[ U_{i j}=\frac{f_{i j}}{c_{i j}} \ \ (12) \]
\(U_{i j}\) - person per day / per unit of throughput.
As an average value of the level of congestion of transport correspondences for the agglomeration as a whole \((\bar{U})\), a weighted average of the congestion of individual transport correspondences is used, where the value of the flow of people along the transport correspondences \(f_{i j}\) is used as a weight.
The average value of congestion for the agglomeration then will be equal to:
\[ \bar{U}=\frac{\sum_{i j} U_{i j} f_{i j}}{\sum_{i j} f_{i j}} \ \ (13) \]
The volume of capital investments required to bring the level of congestion of each transport correspondence to the average value for the agglomeration is determined as follows:
\[ P_{i j}=P_{0} \cdot L_{i j} c_{i j}\left(\frac{U_{i j}}{\bar{U}}-1\right) \ \ (14) \]
where \(P_{0}\) - the cost of increasing road throughput by 1 conventional unit over 1 km (in million rubles)
7.10.4 Description of Model Input Variables
The input variables used are:
| № | Notation | Description | Unit of measure |
|---|---|---|---|
| 1 | \(p_{i}\) | Working-age population | person |
| 2 | \(w_{i}\) | Average headcount of employees of enterprises | person |
| 3 | \(l_{i j, \alpha \beta}\) | Length of routes between settlements lying in neighboring areas \(i\) and \(j\) | km |
| 4 | \(\tau_{i j, \gamma}\) | Road classes crossing the boundaries of areas \(i\) and \(j\) | conventional units |
| 5 | \(c(\tau)\) | Correspondence of road categories by OpenStreetМар resource and their throughput (in conventional units) | |
| 6 | \(P_{0}\) | The cost of increasing the throughput of the road by 1 conventional unit over 1 km (according to sources 4 and 5) | mln rubles / km / unit of throughput |
The data sources used are:
- FSSS (Rosstat) website, Section of Municipal Statistics
- Federal Tax Service database
- Cartographic database OpenStreetMap and 2GIS
- NCS 81-02-08-2021 Collection № 08. Highways
- SNiP 2.05.02-85 Highways
The table of correspondence of road categories and their throughput was built based on a comparison of data on road types from the OpenStreetMap Internet resource, standard throughput of a similar type (class) of roads according to SNiP 2.05.02-85.
To calculate the required volume of capital investments, a calculated standard for the cost of building a conventional unit of transport correspondence throughput is determined. The value is calculated as the median standard cost of building 1 lane of road with a given quality factor. The number of conventional units of increase in throughput is defined as the difference between the actual throughput of the transport correspondence and that required to ensure its congestion at the median level. The volume of capital investments is defined as the product of the required volume of increase in throughput, the length of the transport correspondence and the cost of increasing the throughput unit in a section of 1 kilometer long.
The cost of increasing the throughput of the road by 1 conventional unit over 1 km is determined by NCS 81-02-08-2021.
7.10.5 Description of the model result
As results, the model allows to find the following data:
| Notation | Description | Unit of measure |
|---|---|---|
| \(f_{i j}\) | expected human flows through transport correspondences | person / day |
| \(k\) | areas with the highest and lowest ratio of the working-age population to the average headcount | areas |
| \(U_{i j}\) | congestion of transport correspondences | person / day / unit of throughput |
| \(P_{i j}\) | cost of construction (reconstruction) of transport correspondences to ensure congestion not more than the current weighted average level of congestion | million rubles |
7.10.6 Calibration of the model
The task of calibration is to compare spatial data on road types (used to calculate the actual throughput of transport correspondences) with the throughput (traffic intensity) standards specified in the guiding documents of the Ministry of Construction of the Russian Federation.
Calibrated parameters include: - specific traffic intensity (i) in the calculation both for the road as a whole and for 1 lane of road traffic - specific volume of capital investments calculated both for 1 km of the entire road and for 1 km of 1 lane of road traffic - parameter for selecting a data source (traffic intensity, capital investments) to assess the throughput of each class of road according to the OpenStreetMap classifier
Below is an algorithm for constructing a table of correspondence between the OpenStreetMap road class and road throughput (traffic intensity) used in the Model: 1. The number of lanes for each of the roads is estimated based on data from the OpenStreetMap cartographic database 2. Relevant road categories are identified from SNiP 2.05.02-85, for which minimum and maximum values of vehicle traffic intensity in units/day characterizing road network capacity are selected 3. OpenStreetMap road categories and road categories according to SNiP 2.05.02-85 are compared by road surface type and number of lanes 4. For each OpenStreetMap road class, the traffic intensity value from SNiP in the range from minimum to maximum is determined 5. Throughput of roads of the corresponding category is determined as a coefficient proportional to the intensity of vehicle traffic 6. On the basis of the NCS 81-02-08-2021 construction standards, the cost of building roads of the corresponding category (taking into account the specific quality of the road surface) per 1 km will be determined 7. The cost of building 1 lane of road of the corresponding category as a conventional unit of throughput is determined 8. The cost of building roads is determined to increase the throughput of the transport correspondence (to the level of the median value of congestion)
7.10.7 Result of model application
During the trial operation, the model was tested on three agglomerations. Human flows through transport correspondences, congestion of transport correspondences, as well as the volume of capital investments for their reduction were calculated.
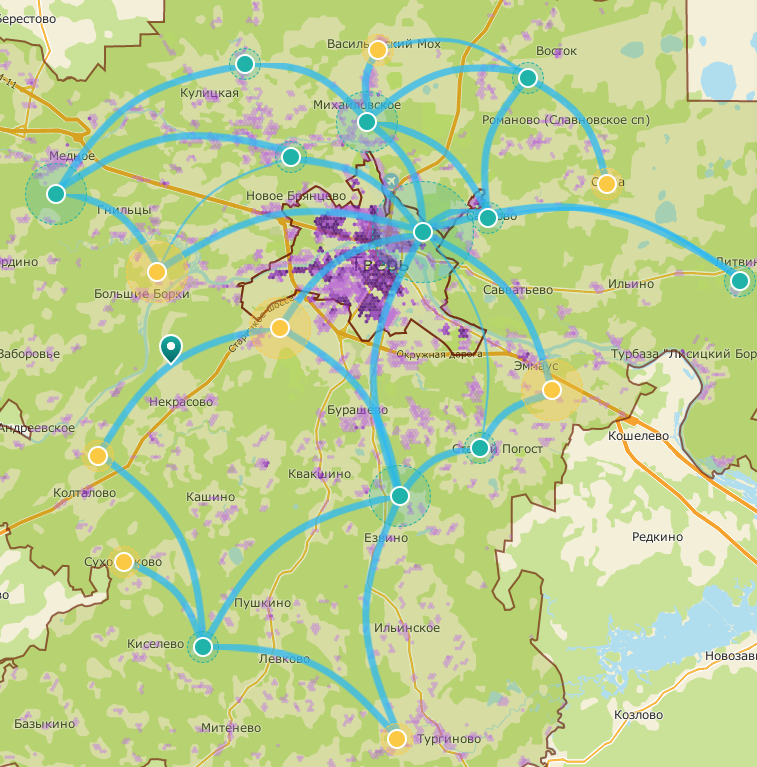
Example of displaying calculation results
7.10.8 Requirements for model support and regularity of its recalibration
Updating the calibrated parameters is necessary annually as statistical information on basic parameters is published, as well as in the following cases: - upon change of the road graph (construction or reconstruction of highways) - when changing the standard cost of construction of highways