9.1 Analysis of regional emissions: a word for poor Kemerovo
Fuel and energy balances are a treasure trove of information for analyzing the situation in regions. One can extract a lot: the structure of fuel and energy resource consumption; the division into producers and buyers; the efficiency of converting primary resources into electricity and heat; energy efficiency of the fuel and energy complex (the share of final consumption in the total fuel output), and so on; there are plenty of options.
In particular, energy balance tables allow for the estimation of greenhouse gas emissions, which is what we will do in this article.
Sources and limitations of input data
1) Data is available for all regions except: Tatarstan, Mari El, Chelyabinsk Region, Omsk Region, Magadan Region, Primorsky Krai, and Crimea.2) The available 78 tables are distributed by year as follows:
| Год | Таблицы ТЭБ |
|---|---|
| 2020 | 56 |
| 2021 | 10 |
| 2022 | 10 |
| 2023 | 1 |
| 2030, прогнозный | 1 |
| 78 |
For primary estimates, they are considered as dated by one year — 2020. Since energy balances do not change very significantly from year to year, this assumption was considered a minor sin.
3) In the table for St. Petersburg, information on electrical and thermal energy is missing; for the Samara region, only gas is presented.
4) Data on population and GRP are taken from Rosstat.
5) Conversion factors for the volume of burned fuel into emission volumes are taken from Order of the Ministry of Natural Resources of Russia dated April 16, 2015 No. 15-r, Appendix 2 “Tables to Methodological Recommendations”, Table 1.2 “Recommended values of conversion factors to energy units and carbon dioxide emission factors (t CO2/TJ), methane (kg CH4/TJ), and nitrous oxide (kg N2O/TJ) during stationary fuel combustion”
According to EDGAR data, total CO2 emissions in Russia amounted to 1,798 million tons. According to BP data — 2,011 million tons. Our calculations for 78 regions showed 1,707 million tons, meaning the calculation methodology gives a similar result.
Half of all emissions come from 10 regions:

The profiles of absolute and specific values differ somewhat: for example, Moscow and the Moscow region together generate 7.3% of all-Russian carbon dioxide emissions, but due to the large population, they do not fall into the top 10 in terms of specific indicators. As a result, the leaders (or, given the context, anti-leaders) can be called the Yamalo-Nenets Autonomous Okrug, the Khanty-Mansiysk Autonomous Okrug, and the Kemerovo Region.
In the Yamalo-Nenets Autonomous Okrug, 140 million tons of CO2 emissions out of 164 (i.e., 85%) come from gas combustion during extraction, processing, and transportation. The same percentage of emissions (65 million tons out of 77) comes from gas in Khanty-Mansiysk, but from other sources: combustion during the production of electrical and thermal energy, and use in industry and transport.
But the story of the Kemerovo Region is predictably different. The main culprit for carbon dioxide emissions is coal. 144 million tons out of 160, i.e., 91% of total emissions, come from coal combustion.

Next, let’s consider methane emissions — in this case, half of the emissions also come from 10 regions:

Here, the Kemerovo Region “leads” in both absolute and specific terms. The Yamalo-Nenets Autonomous Okrug shows relatively low absolute values, but when calculated per person, it becomes second — the Sakhalin Region does not appear in the absolute top 10 ranking at all, but is third in terms of specific indicators.
Altai Krai owes its second place to impressive coal consumption for non-fuel needs, and in Zabaykalsky Krai, high values are associated with the combustion of other solid fuels (peat briquettes and semi-briquettes, firewood, etc.).
Emissions from coal combustion in the Kemerovo Region now account for 96% of the total volume — it’s interesting to look at the breakdown by industry again:

Unlike CO2 emissions, for methane, the residential sector, agriculture/forestry/fishing, and fish farming are the main sources — the volume of coal burned by these industries is the lowest, but it is they, due to their specificity, that emit the most methane per unit of fuel burned.
Finally, let’s move on to nitrous oxide:

The Kemerovo Region again “leads” in both absolute and specific terms — and even more markedly. The Yamalo-Nenets Autonomous Okrug also repeats itself: it demonstrates relatively low absolute values but ends up in second place in specific ones. Further, high values are shown by Khabarovsk Krai: third place per person, and fifth for absolute values.
For N2O, emissions from coal combustion in the Kemerovo Region account for 97% of the total volume — the breakdown by industry is as follows:

The distribution of all regions is presented in the interactive graph below — emissions are normalized, logarithmic scales are used, the size of the circles is proportional to the population of the region:
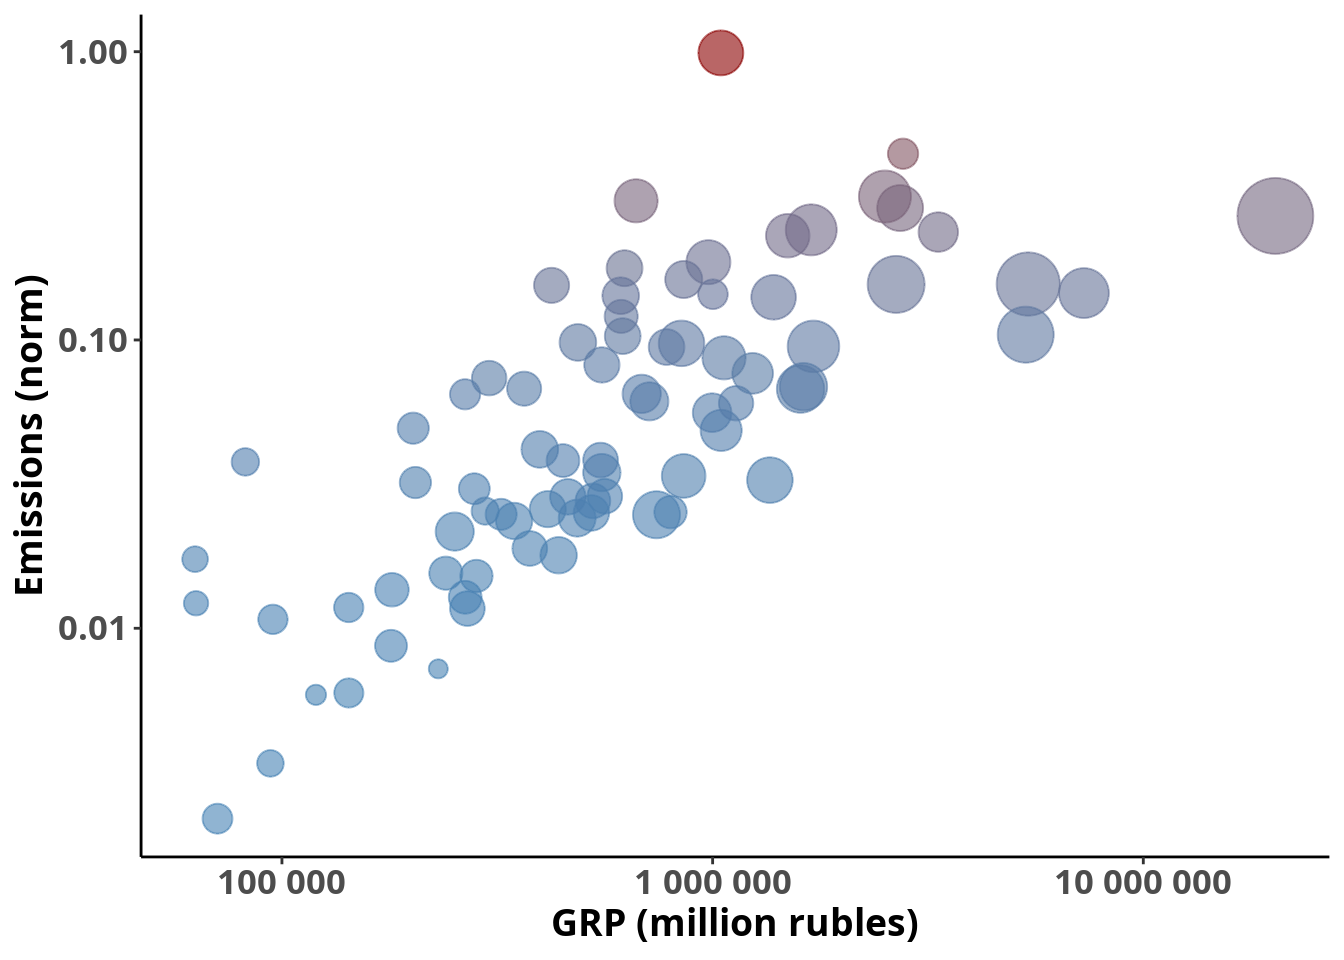
Moscow stands out for its population and GRP… and the Kemerovo Region stands out for its emissions. The ecological situation looks catastrophic, given that, according to our estimates, switching the region to gas or thermal energy will have a positive effect not only on the quality of life and health of people but also on the economy.
Gas is more expensive, but at the same time more energy-efficient, meaning less of it is required — when replacing coal with gas in the final consumption of the population, the total cost of fuel and energy resources will decrease by 350 million rubles per year. Gasification of the service sector will save 40 million rubles per year, gasification of industry by a quarter (i.e., replacing a quarter of coal consumption with gas; since it is impossible to completely get rid of the use of coal, as some production processes require it, a quarter was taken for estimation) — 1.4 billion rubles per year.
Replacing half of coal consumption for non-fuel needs with gas will save 4.5 billion rubles per year; carbon dioxide emissions will decrease by 10.6%, methane — by 9.6%, and nitrous oxide — by 21%.
A win, so to speak, on all sides.